Introduction
OneUptime is an open-source platform that goes a step further than a typical APM tool: it bundles uptime monitoring, status pages, incident management, on-call scheduling, and OpenTelemetry-based observability (logs, traces, metrics, exceptions) into a single app. Instead of stitching together Pingdom + PagerDuty + Datadog + Sentry, you get one self-hosted stack.
Pros:
- One platform for monitoring and incident response — traces/logs feed directly into incidents, on-call, and status pages
- Native OTLP ingestion, so any OpenTelemetry SDK or collector works without a custom exporter
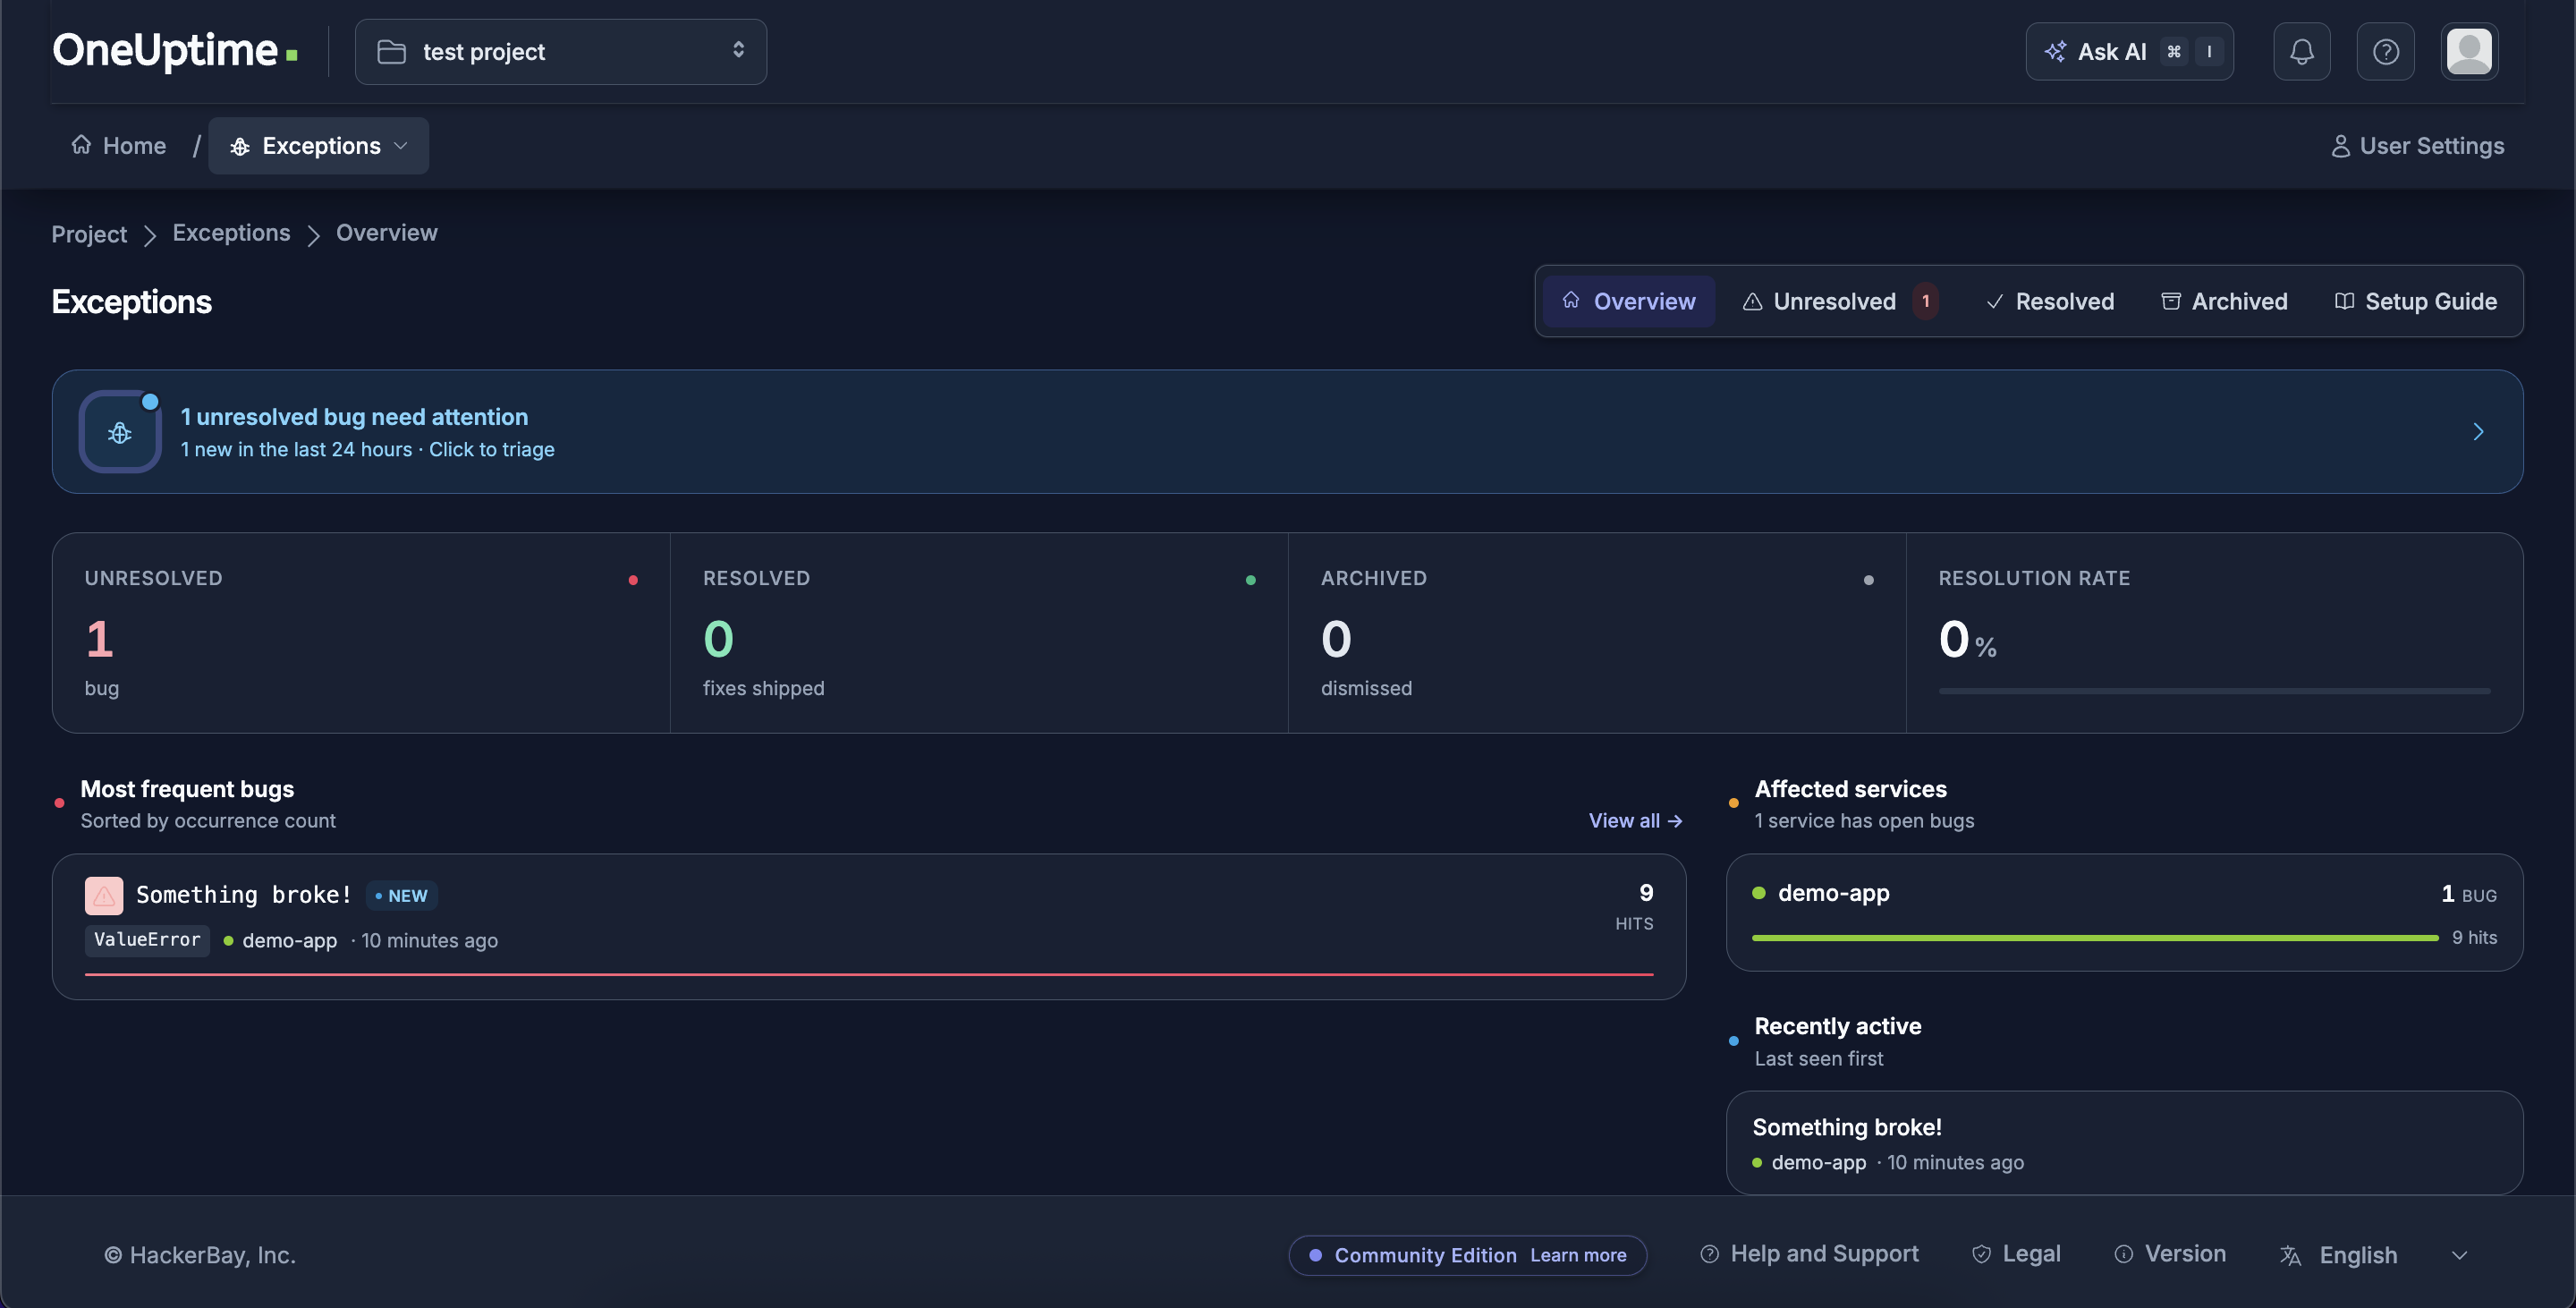
- Automatic exception extraction from both trace errors and raw log stack traces, grouped into one Issues view
- Apache 2.0, fully self-hostable, no per-seat pricing on the community edition
Cons:
- The full stack is heavier than a single-purpose APM tool — it runs three databases (ClickHouse, PostgreSQL, Redis) plus the app tier
- Younger ecosystem than Datadog/Grafana-shaped tooling, so fewer third-party integrations and community dashboards
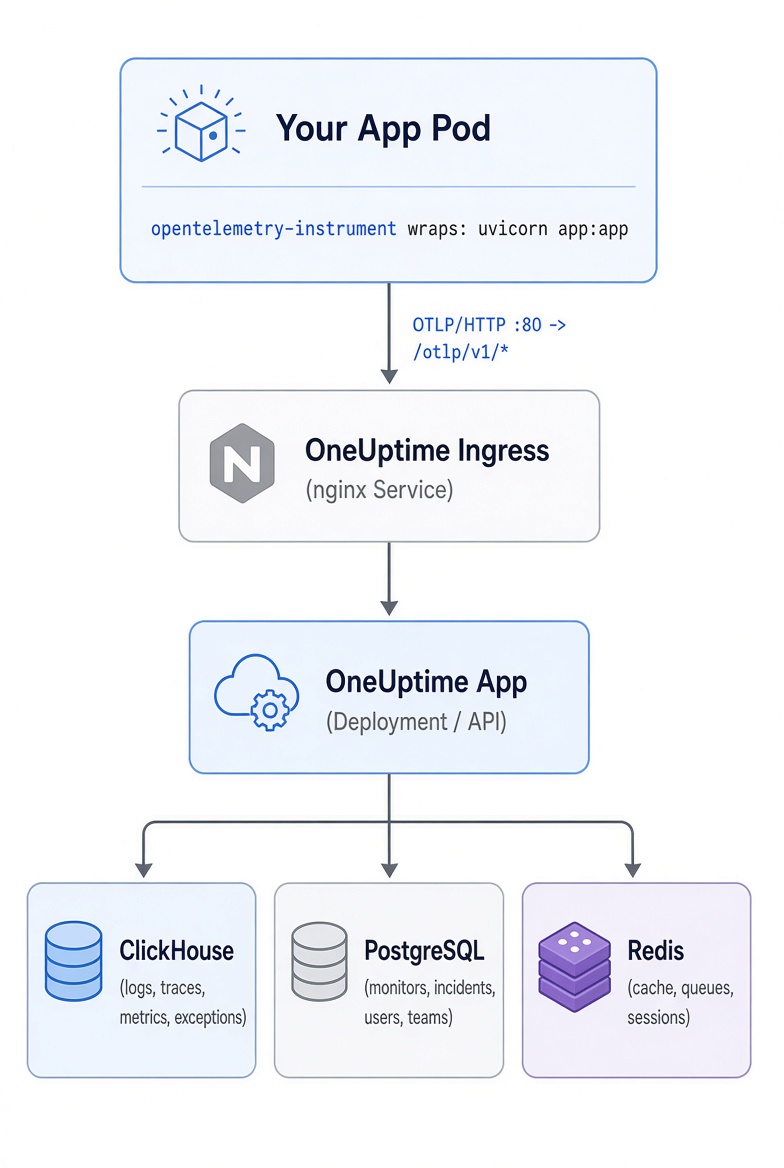
Architecture
Part 1: Deploy OneUptime on Kubernetes
Prerequisites
- A running Kubernetes cluster (this guide uses a local cluster — kind, minikube, or k3s all work)
kubectlwith admin access- Helm
The chart templates everything OneUptime needs to run standalone:
- ClickHouse – all telemetry: logs, traces, metrics, exceptions
- PostgreSQL – monitors, incidents, users, teams, workflows
- Redis – cache, work queues, sessions
- nginx – the ingress gateway in front of the app, worker, and probe pods
Add the Helm repo
helm repo add oneuptime https://helm-chart.oneuptime.com/
helm repo update
Create a values file
# oneuptime-values.yaml
host: "localhost:8080" # must match the local port you'll port-forward to below
httpProtocol: http

global:
  storageClass: local-path # run `kubectl get storageclass` and match yours

nginx:
  service:
    type: ClusterIP
image:
  type:
    community-edition
If your cluster’s default StorageClass isn’t named standard (minikube uses standard too, but kind needs one installed separately — see below), update global.storageClass accordingly.
kind users: kind has no default StorageClass out of the box. Install the local-path-provisioner first, or run
kubectl get storageclassto confirm one already exists before installing.
Install OneUptime
helm install my-oneuptime oneuptime/oneuptime \
  -f oneuptime-values.yaml \
  --create-namespace \
  -n oneuptime \
  --timeout 15m
Check that everything came up:
kubectl get pods -n oneuptime
If the app pods sit in CrashLoopBackOff right after install, that’s usually the migration Job still running — check it before assuming something is broken:
kubectl get jobs -n oneuptime -l app.kubernetes.io/component=migrate
kubectl logs -n oneuptime -l app.kubernetes.io/component=migrate
Access the UI
kubectl port-forward -n oneuptime service/my-oneuptime-nginx 8080:80
Open http://localhost:8080 and sign up for your first account — self-hosted OneUptime has no seeded admin user, so the first account you register becomes the project owner. After signing up, create your first project if you’re not dropped into one automatically
Create a telemetry ingestion token
With a project selected, click Products in the top navigation, then Project Settings. Inside Project Settings, find Telemetry & APM in the settings sidebar and click Ingestion Keys, then Create Ingestion Key. Copy the value — this is the x-oneuptime-token your apps and collectors will send on every OTLP request.
Part 2: Instrument a FastAPI App
Install dependencies
pip install fastapi uvicorn opentelemetry-distro opentelemetry-exporter-otlp
opentelemetry-bootstrap -a install
With the agent handling setup, application code is just the app — no telemetry imports, no provider wiring:
app.py
import logging
import time

from fastapi import FastAPI
from opentelemetry import metrics

logging.basicConfig(level=logging.INFO)
logger = logging.getLogger(__name__)

app = FastAPI()

meter = metrics.get_meter(__name__)
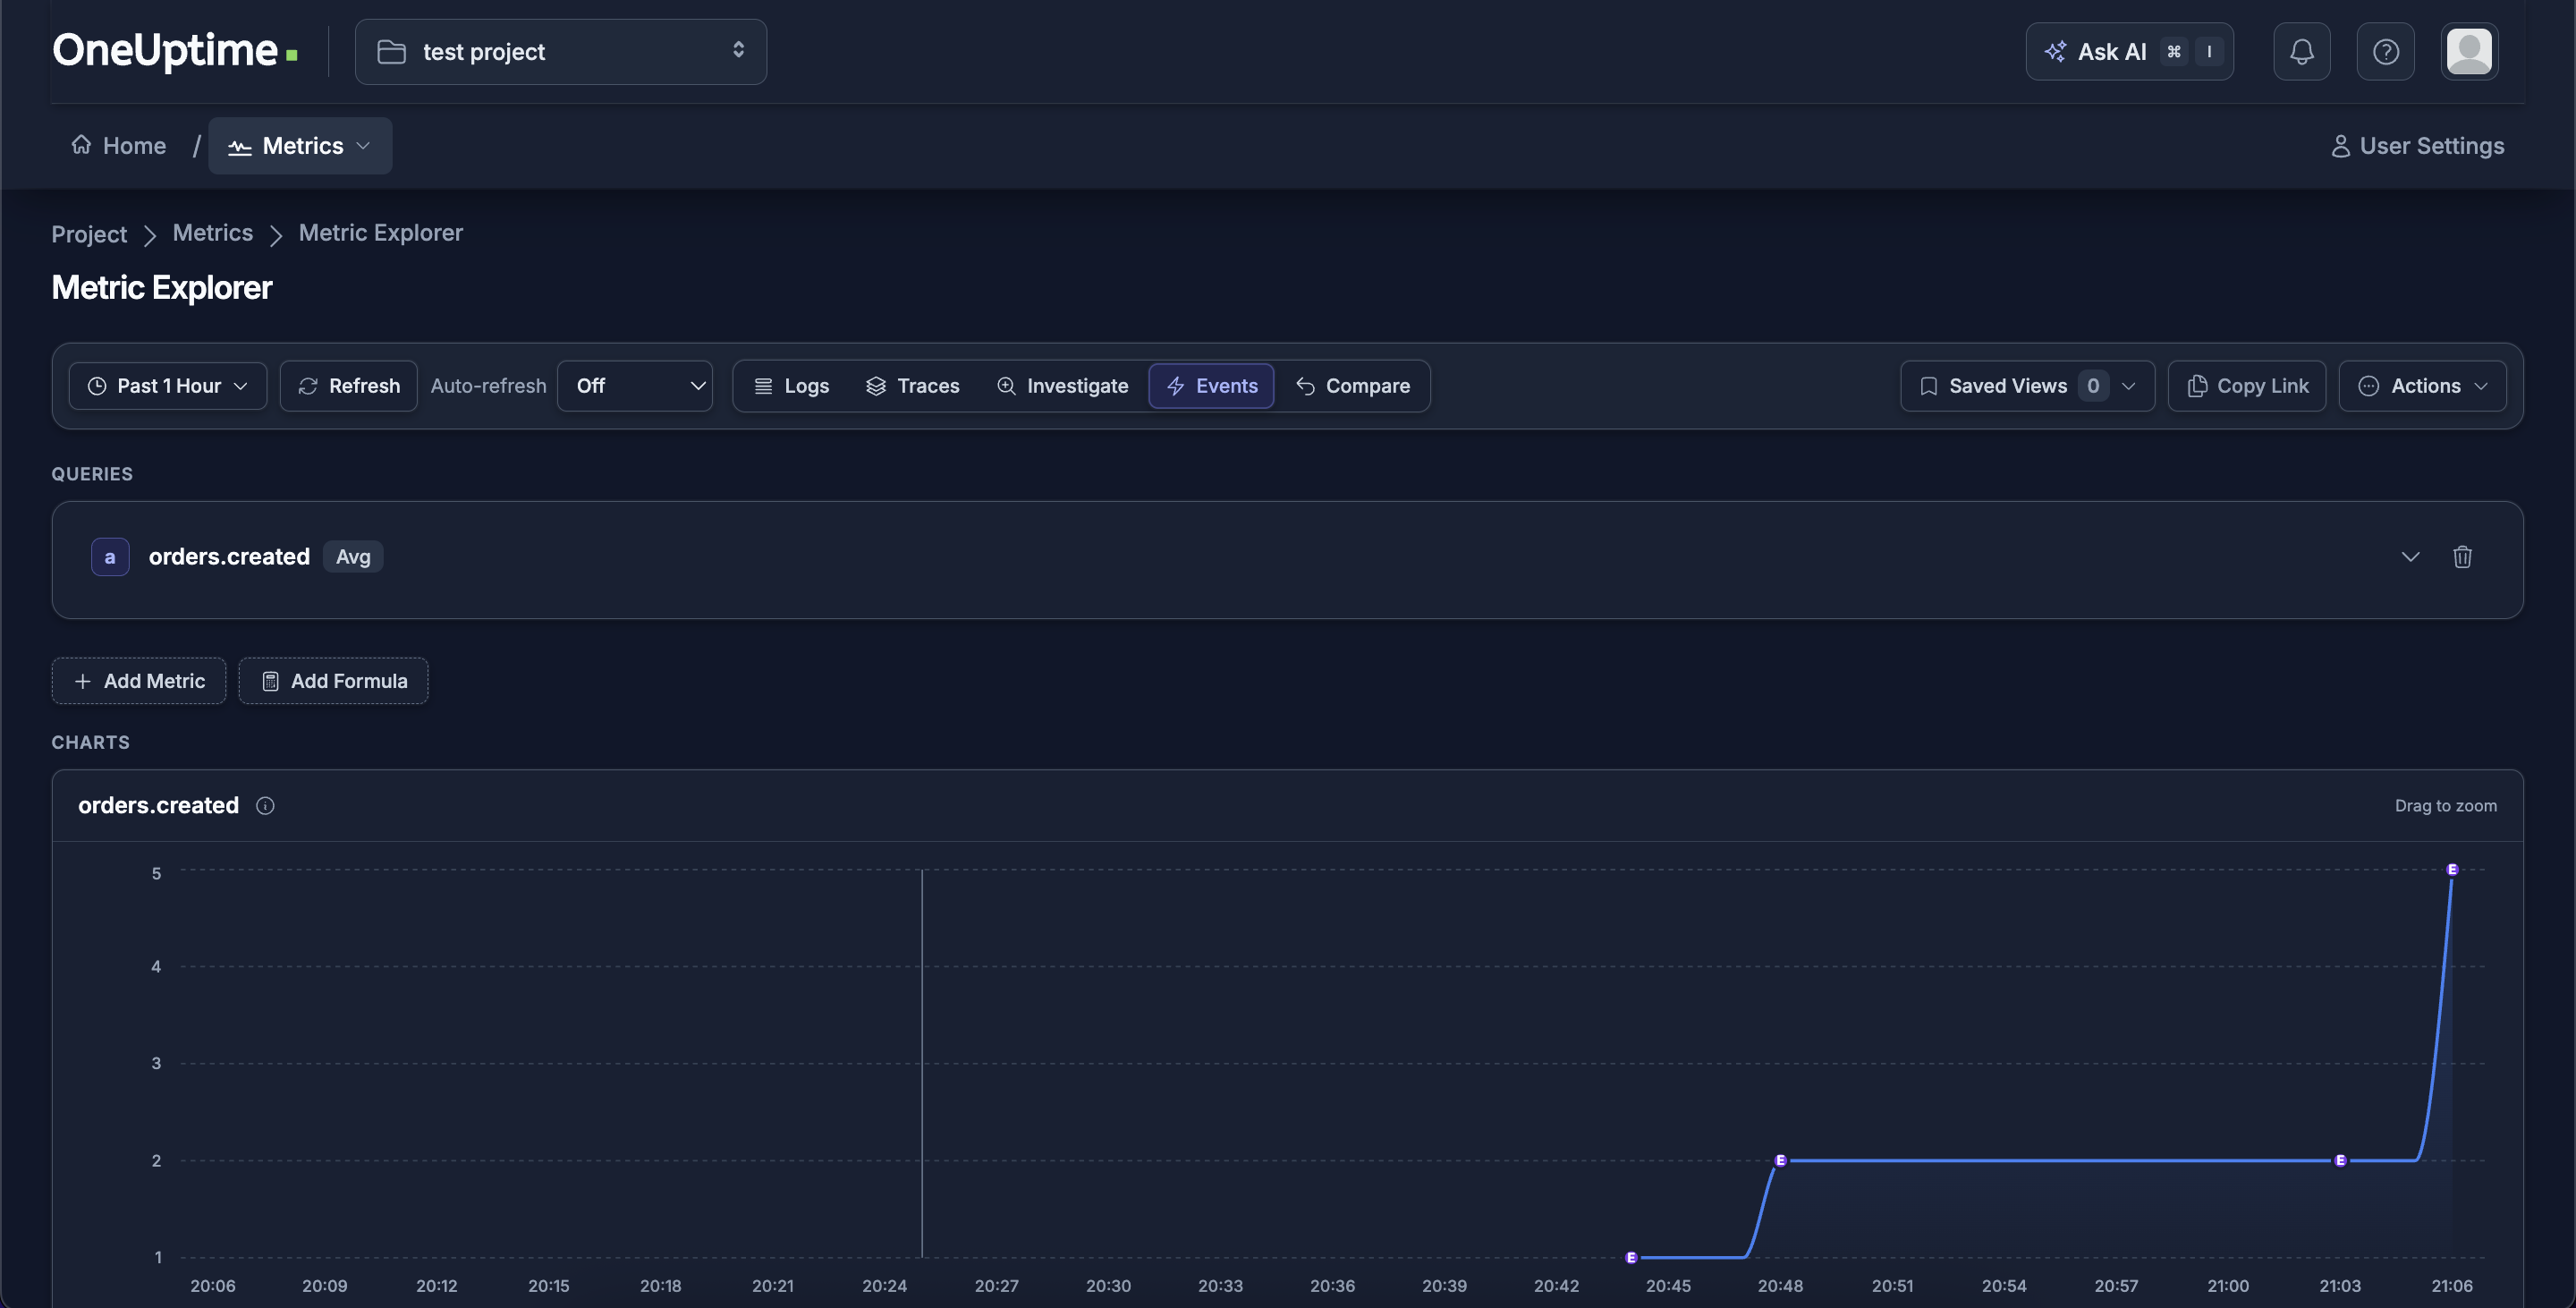
order_counter = meter.create_counter("orders.created", description="Number of orders created")


@app.get("/")
def home():
    logger.info("Home visited")
    return {"message": "Hello"}


@app.get("/order")
def create_order():
    logger.info("Creating order")
    time.sleep(1)
    order_counter.add(1)
    logger.info("Order created")
    return {"order_id": 123}


@app.get("/error")
def trigger_error():
    try:
        raise ValueError("Something broke!")
    except ValueError:
        logger.exception("Order processing failed")
        return {"error": "Failed"}, 500
Deploy the app to the cluster
Create a Dockerfile:
FROM python:3.12-slim

WORKDIR /app
COPY app.py .

RUN pip install --no-cache-dir fastapi uvicorn opentelemetry-distro opentelemetry-exporter-otlp \
    && opentelemetry-bootstrap -a install

CMD ["opentelemetry-instrument", "uvicorn", "app:app", "--host", "0.0.0.0", "--port", "8000"]
Build and load the image into your local cluster:
docker build -t demo-app:latest .

# kind
kind load docker-image demo-app:latest

# minikube
minikube image load demo-app:latest
Create deployment.yaml:
apiVersion: apps/v1
kind: Deployment
metadata:
  name: demo-app
  namespace: demo
spec:
  replicas: 1
  selector:
    matchLabels:
      app: demo-app
  template:
    metadata:
      labels:
        app: demo-app
    spec:
      containers:
        - name: demo-app
          image: demo-app:latest
          imagePullPolicy: IfNotPresent
          ports:
            - containerPort: 8000
          env:
            - name: OTEL_EXPORTER_OTLP_HEADERS
              value: x-oneuptime-token=<YOUR-DIGESTION-TOKEN>
            - name: OTEL_EXPORTER_OTLP_ENDPOINT
              value: http://my-oneuptime-nginx.oneuptime.svc.cluster.local/otlp
            - name: OTEL_EXPORTER_OTLP_PROTOCOL
              value: http/protobuf
            - name: OTEL_SERVICE_NAME
              value: demo-app
---
apiVersion: v1
kind: Service
metadata:
  name: demo-app
  namespace: demo
spec:
  selector:
    app: demo-app
  ports:
    - port: 8000
      targetPort: 8000
Change YOUR-DIGESTION-TOKEN with yours
Apply and port-forward:
kubectl create namespace demo
kubectl apply -f deployment.yaml
kubectl get pods -n demo -l app=demo-app
kubectl port-forward service/demo-app 8000:8000 -n demo
Generate traffic
curl http://localhost:8000/
curl http://localhost:8000/order
curl http://localhost:8000/error
Part 3: View Data in OneUptime
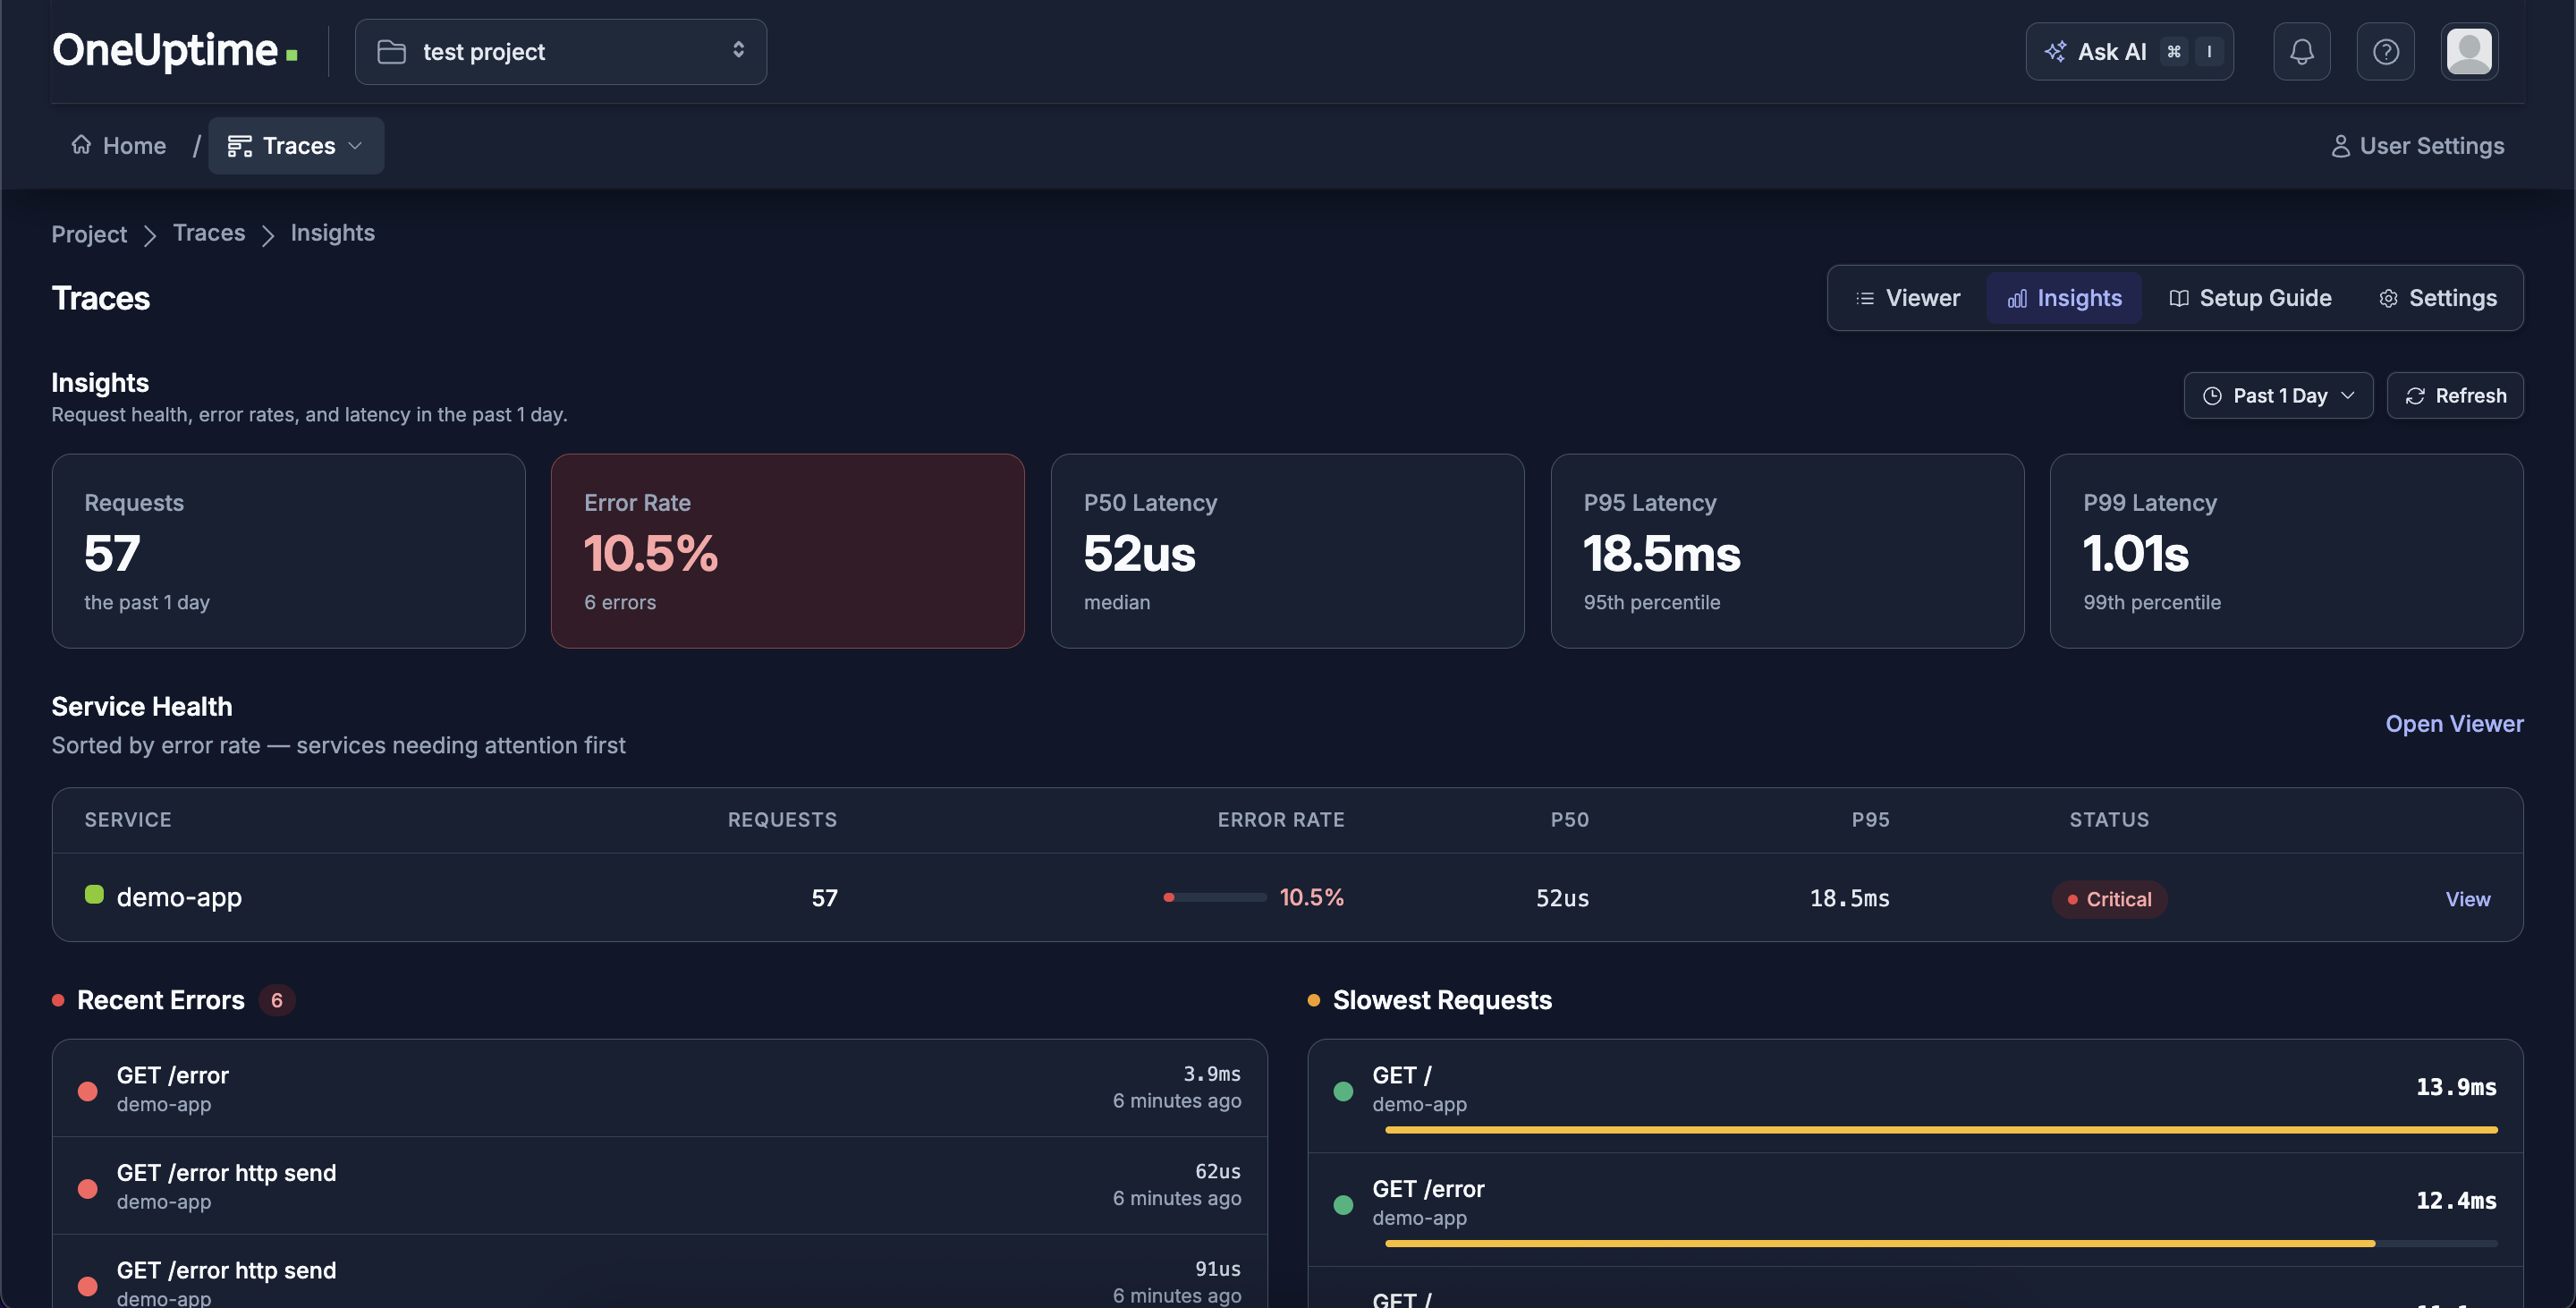
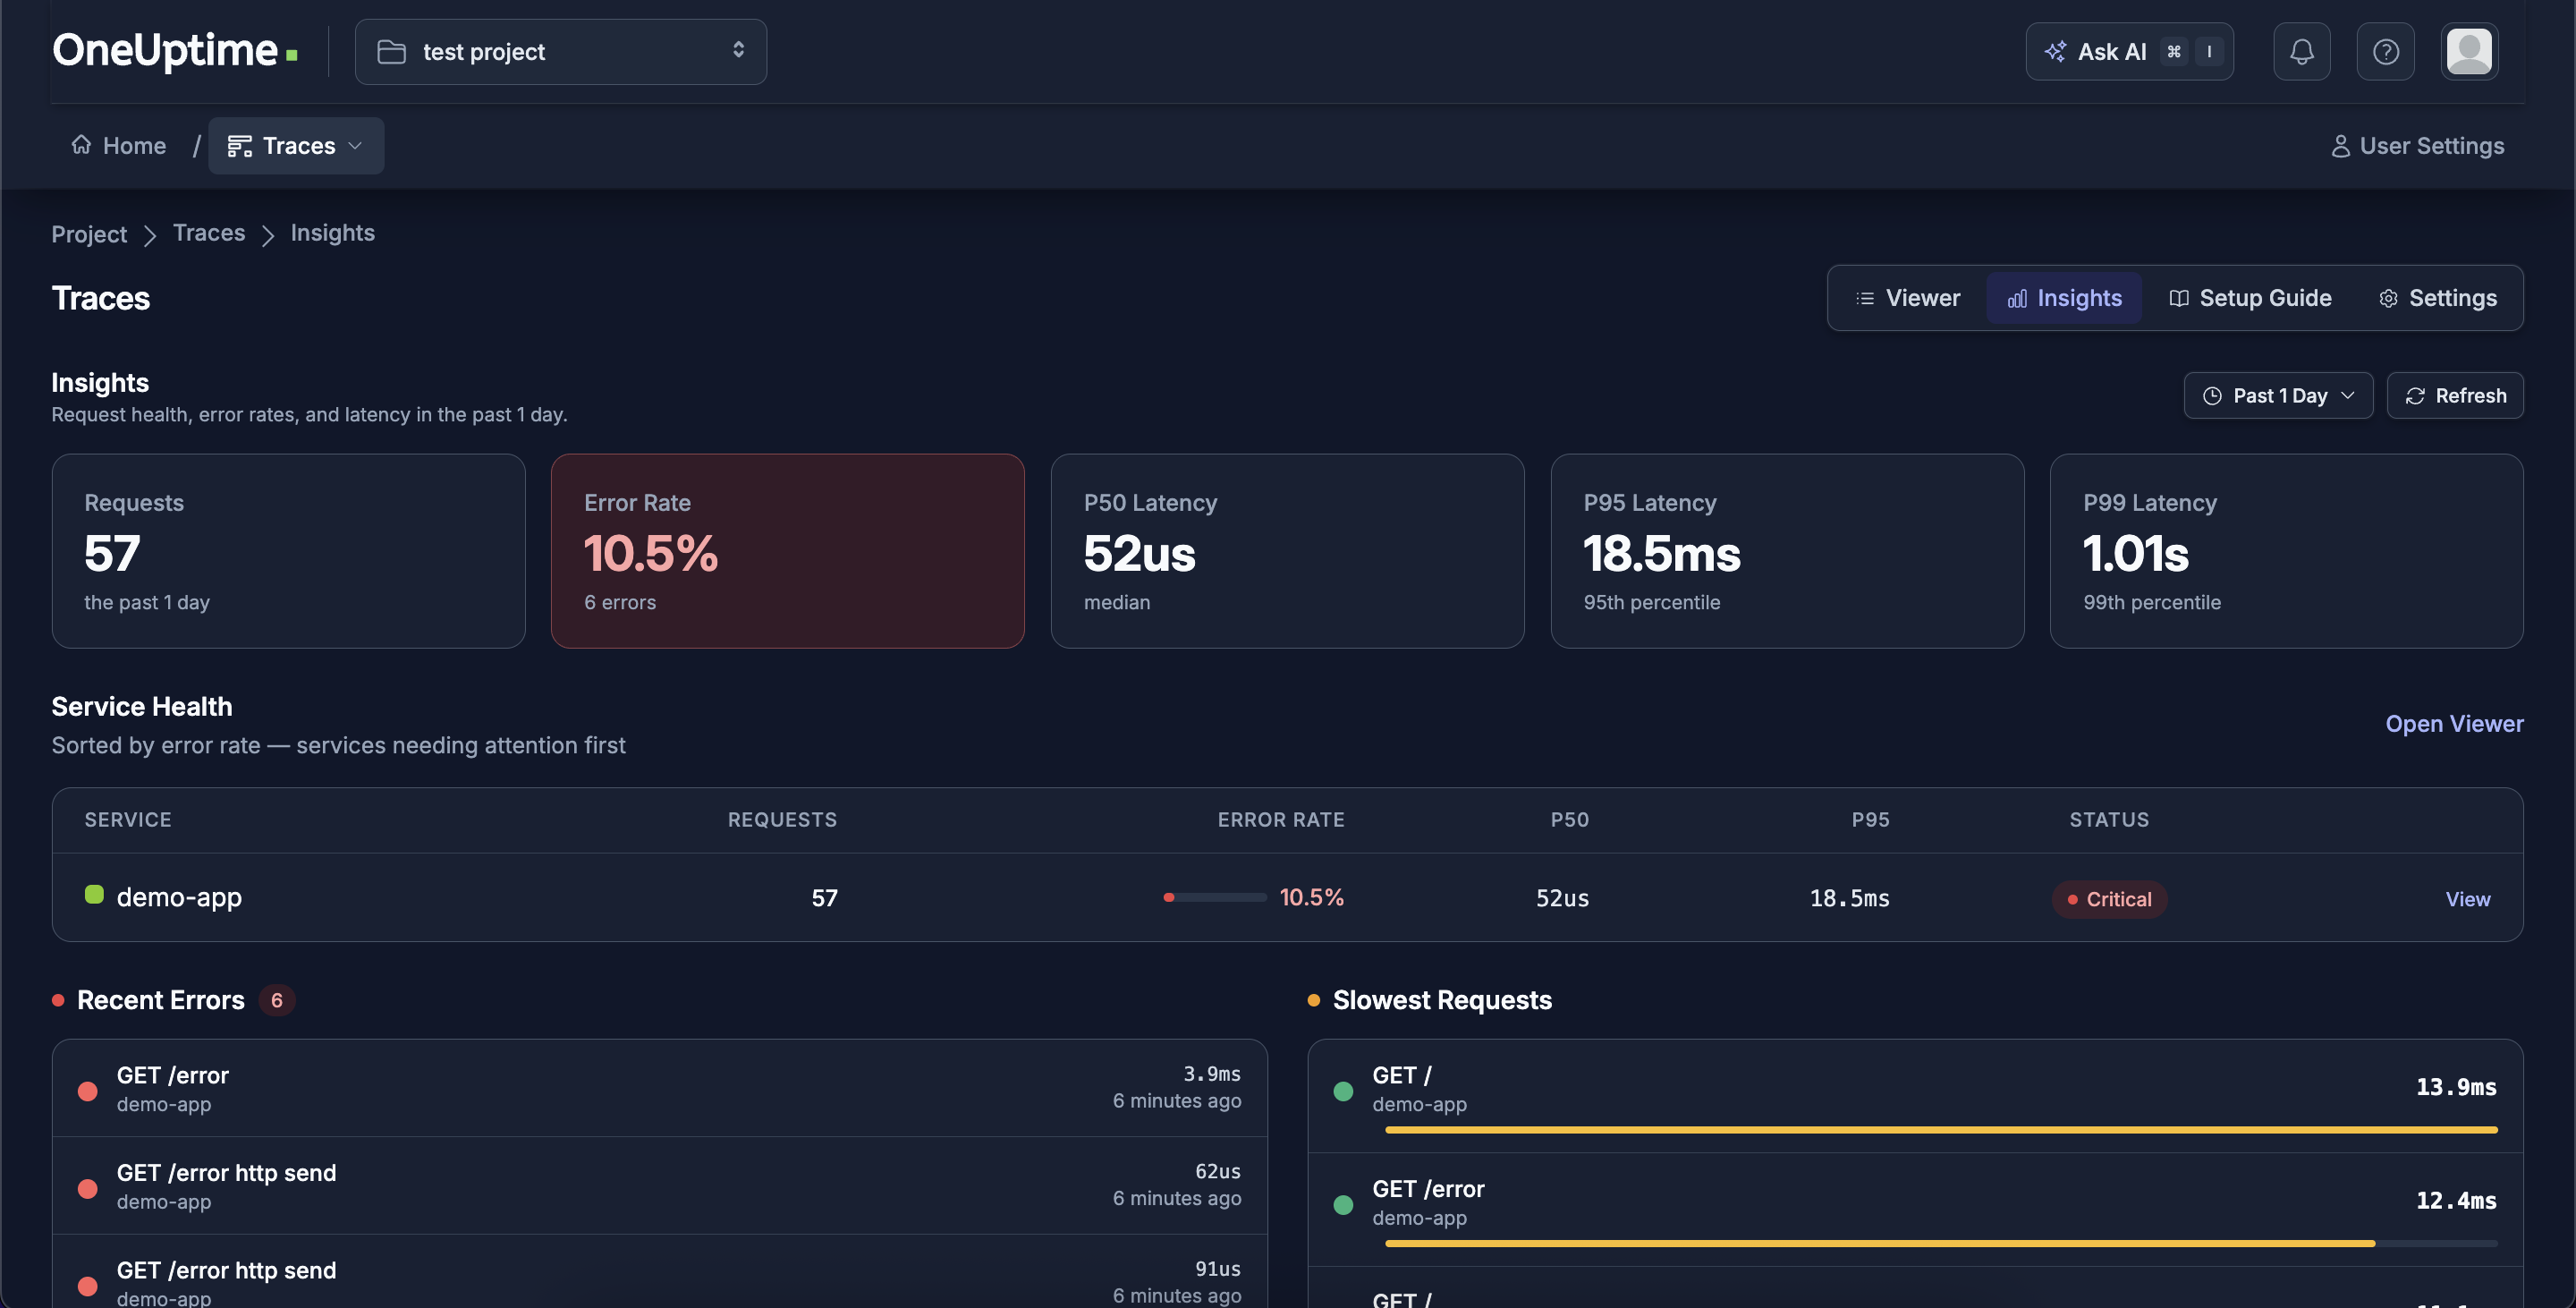
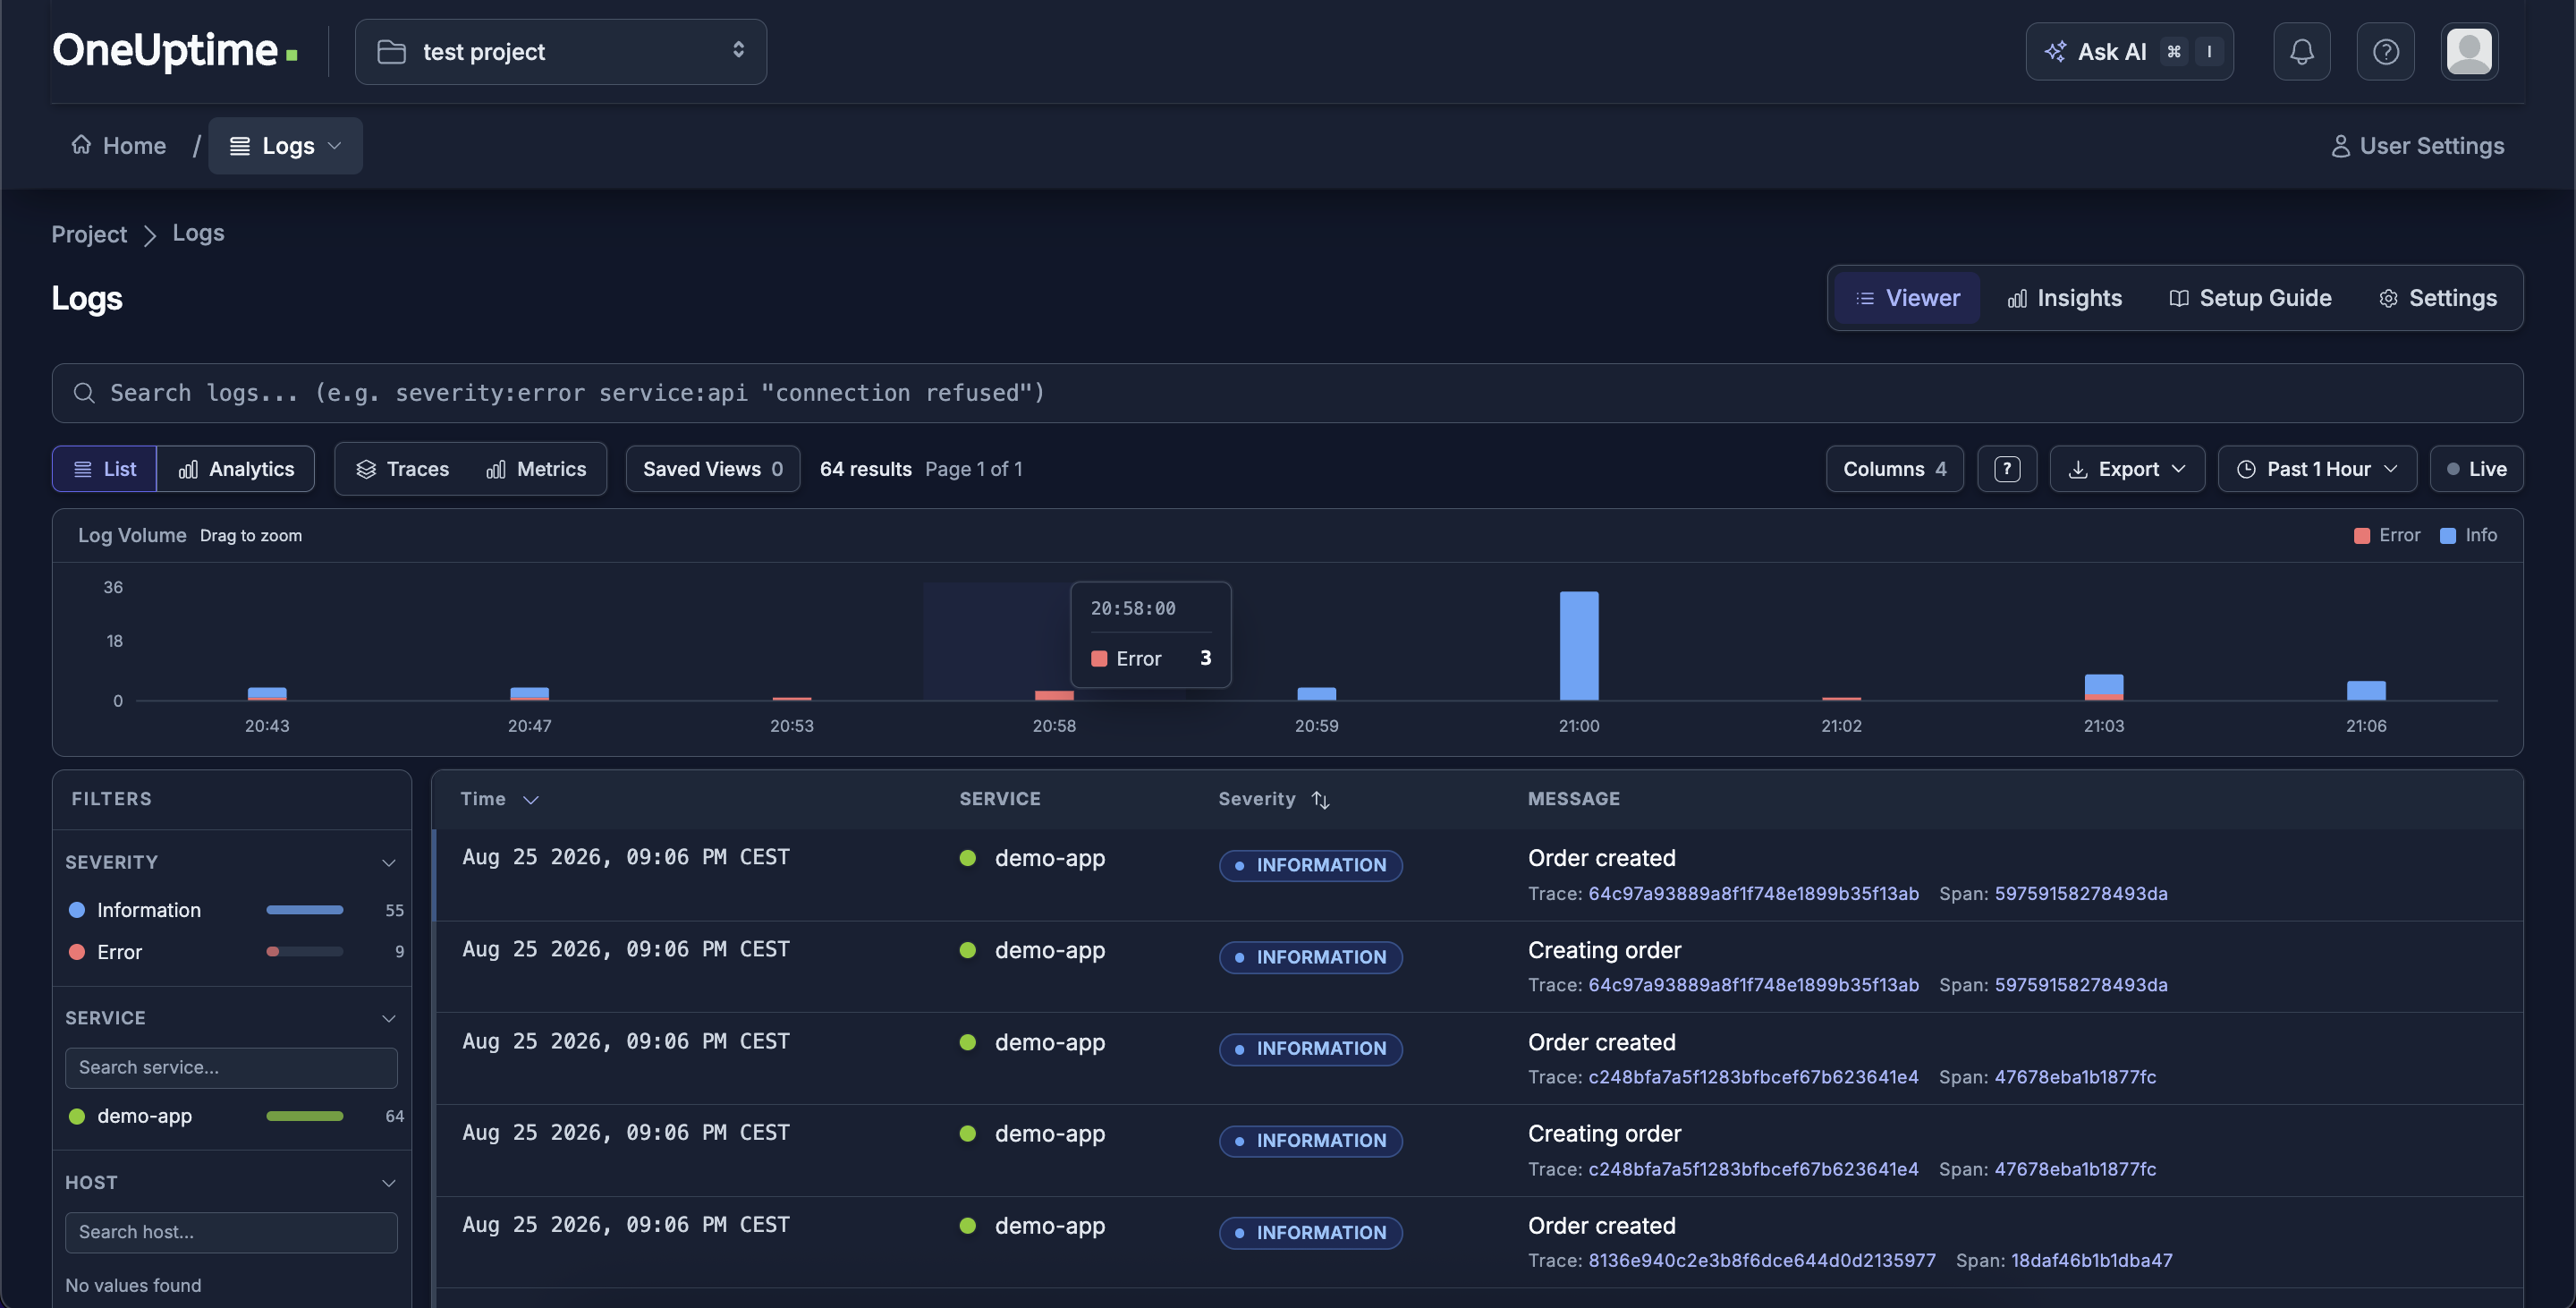
Open the OneUptime UI and navigate to your project. Under products you find observability dashboards, there you can see all kinds of traces, logs, exceptions and metrics related to our app, and much much more outside of this posts’s scope
Traces
Logs
Exceptions (Issues)
Metrics
Part 4: Turn Telemetry into Incidents
This is the part a pure APM tool doesn’t do out of the box. From a trace or a log-derived exception, you can create a Monitor (for example, alert when the /error endpoint’s error rate crosses a threshold) that, when triggered, opens an Incident automatically — which can page an on-call schedule, post to Slack, and update a public Status Page, all from the same telemetry you just ingested.
Configure this under Project Settings → Monitors for the alerting rule, and On-Call Duty for escalation policies. This tutorial’s scope stops at getting telemetry flowing; wiring up on-call and status pages is a good next step once you’ve confirmed data is landing correctly.
Part 5: Cluster-Wide Monitoring with the Kubernetes Agent
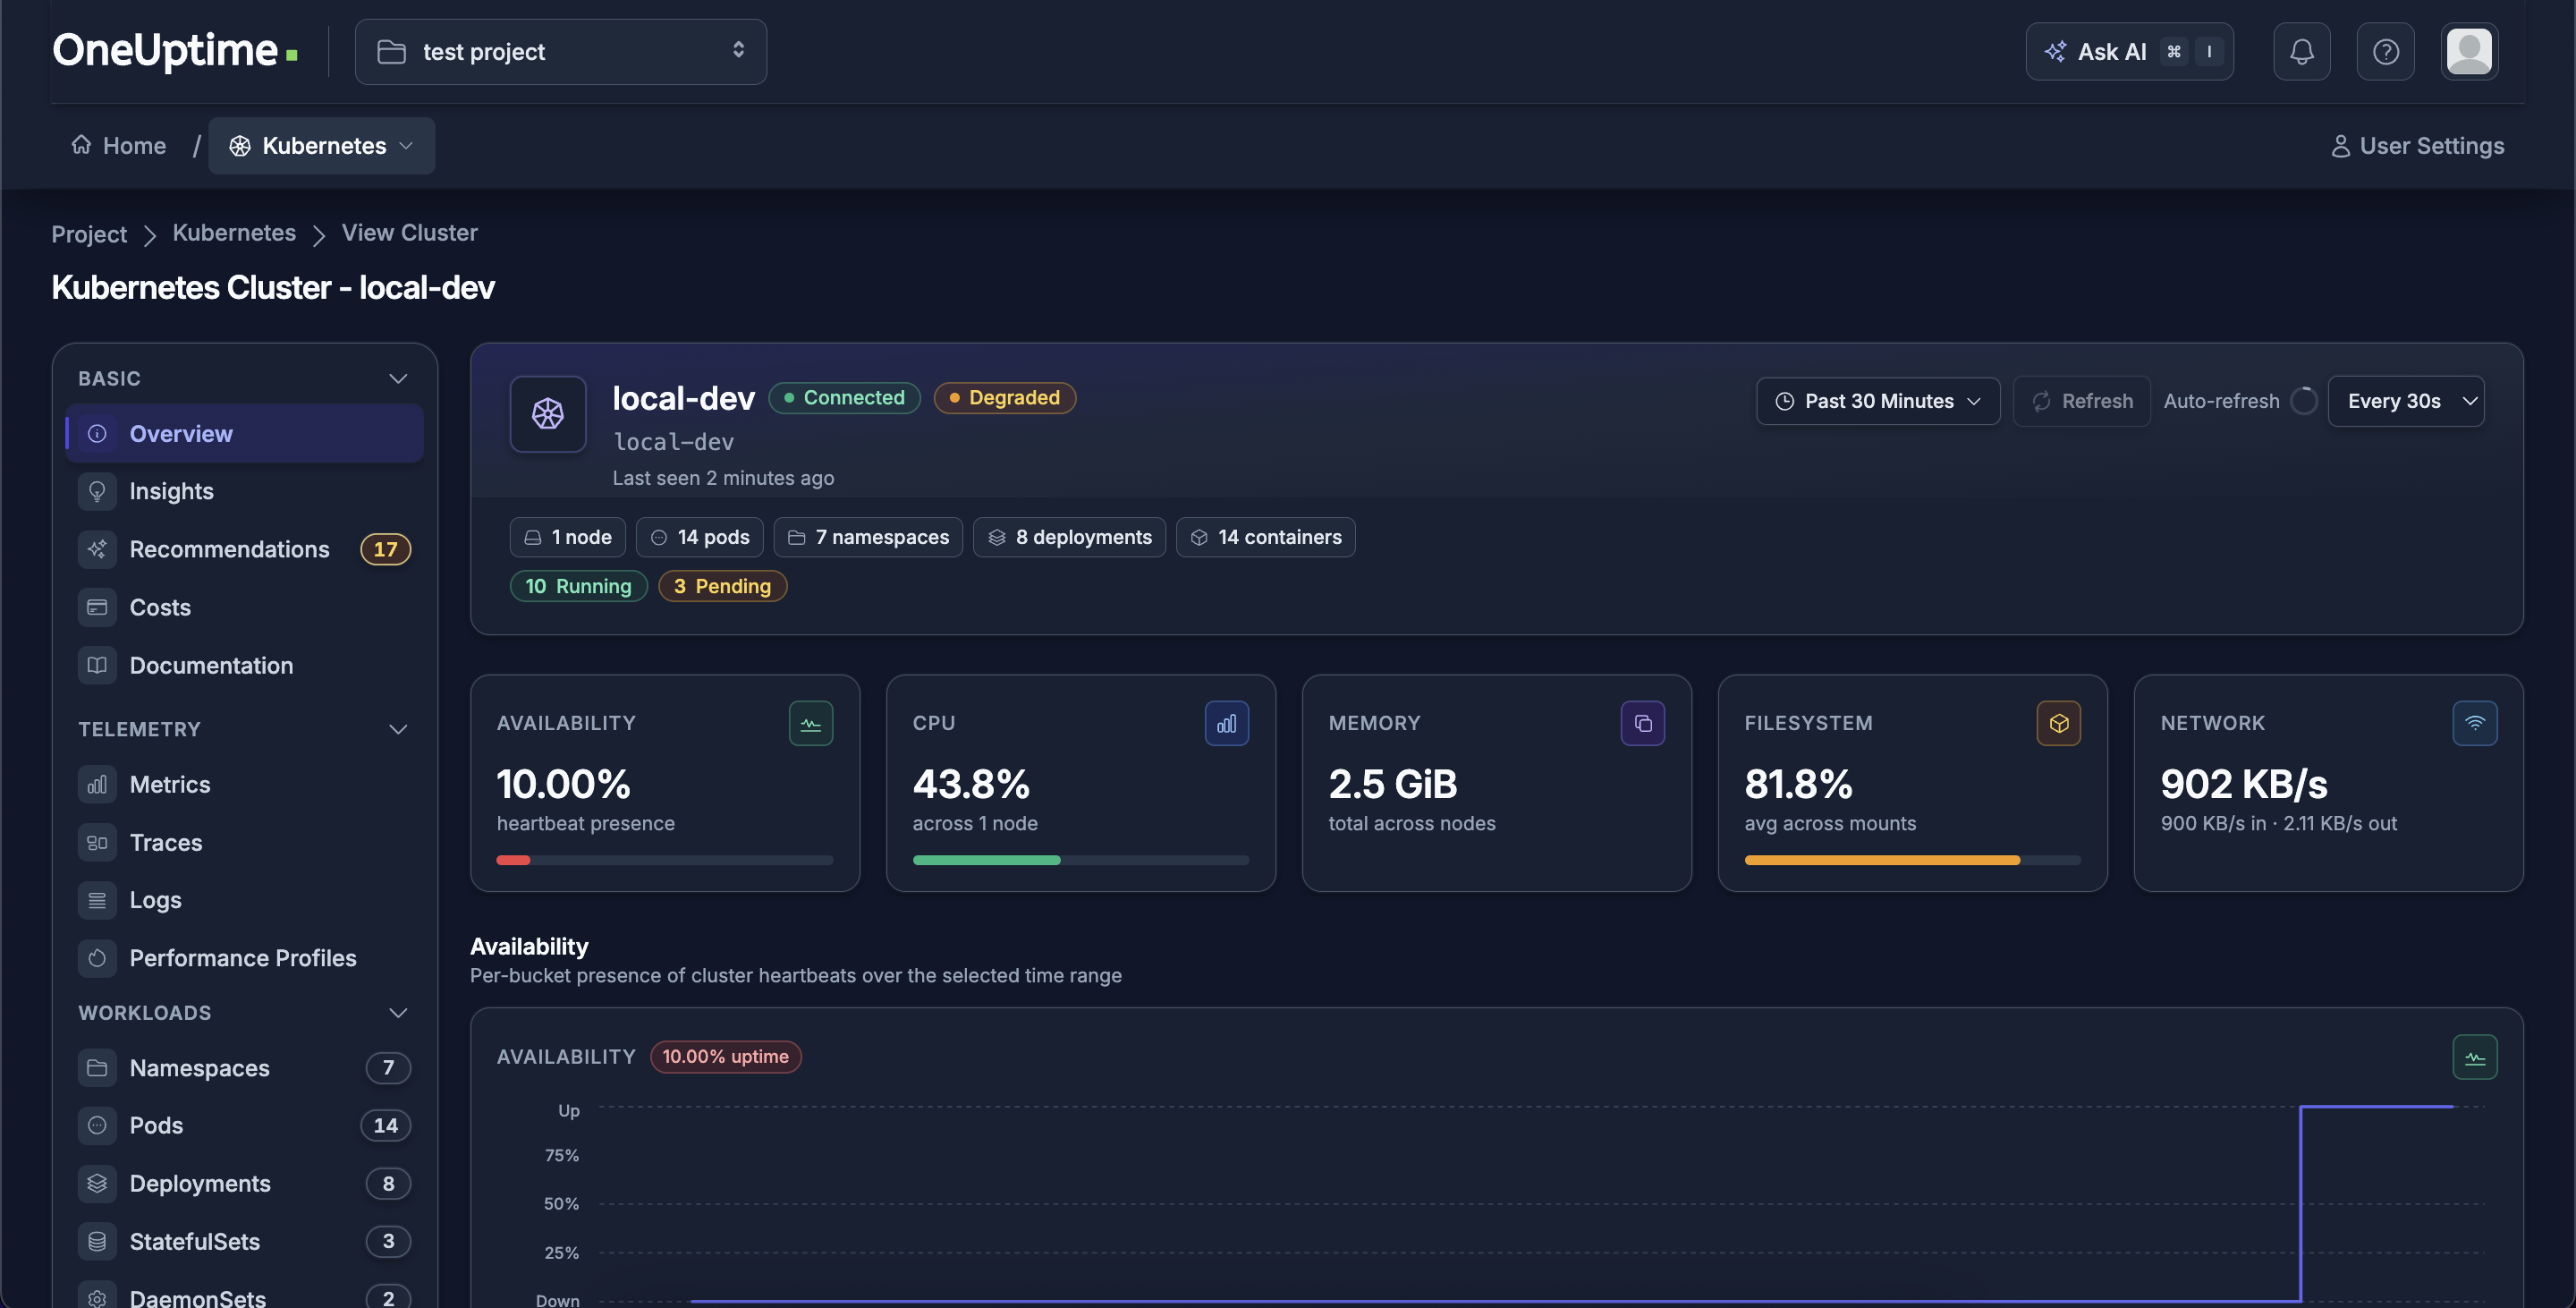
Everything so far ships telemetry from one instrumented app. To also see node/pod/container metrics, Kubernetes events, and pod logs across the whole cluster — without touching application code — install OneUptime’s Kubernetes Agent, a separate Helm chart:
helm install oneuptime-agent oneuptime/kubernetes-agent \
  --namespace oneuptime-kubernetes-agent \
  --create-namespace \
  --set oneuptime.url=http://my-oneuptime-nginx.oneuptime.svc.cluster.local \
  --set oneuptime.apiKey=YOUR_INGESTION_TOKEN \
  --set clusterName=local-dev
This deploys a DaemonSet that tails /var/log/pods for logs and scrapes kubelet stats for node/pod metrics, plus an eBPF-based auto-instrumentation DaemonSet (on by default) that captures HTTP/gRPC traces from every pod on each node — including ones with no OpenTelemetry SDK at all.
Within a few minutes your cluster and its nodes appear under Products → Kubernetes.
Part 6: Cleanup
Remove the demo app:
kubectl delete namespace demo
kubectl delete namespace oneuptime
kubectl delete namespace oneuptime-kubernetes-agent
Part 7: Conclusion
OneUptime gives you one OTel-native pipeline plus the incident-response layer most observability tools leave for you to bolt on separately:
- Traces, logs, and metrics — ingested over standard OTLP, no vendor SDK required
- Exceptions — automatically extracted from both trace errors and log stack traces, deduplicated into one Issues view
- Incidents, on-call, and status pages — built on top of the same telemetry, not a separate product